How should we determine the park needs of communities? How do we figure out whether a city is park-rich or park-poor? Traditionally, park need is measured by the amount of parkland in a city per 1,000 residents and then compared to some standard or goal. For example, if you take a look at the Parks and Recreation Elements of General Plans for most cities in California, you will find a standard or goal for parkland expressed in terms of X acres per 1,000 residents. Recently, I read an article in Builder which identifies the top ten cities in the U.S. with the most park acreage per 1,000 households. By using the number of households instead of residents, this measure is different from what I am used to seeing, but it is still based on the same idea of determining the level of park need based on the amount of parkland. While it is certainly important to know how much parkland a community has, I suggest that we take a closer look at what the acreage means or includes and consider four additional park metrics as well.
Park Acres per 1,000 Residents
This is a commonly used indicator of the amount of parkland available in a given area. Because it accounts for population size, this metric can be used for comparisons across geographic areas and is often relied upon to provide a quick indication of how park rich or poor a community is. Many jurisdictions have established standards of how much local and/or regional parkland they want to have. The recently adopted County of Los Angeles General Plan, for example, indicates that the County’s goals are to achieve four (4) acres of local parkland and six (6) acres of regional parkland per 1,000 residents, respectively. Although this indicator is often used as a means to make an apple-to-apple comparison across cities, we really should ask the following questions when presented with such data:
- What parks are included in each community? For example, are natural open spaces, State parks, and other parklands that do not function as local parks included? If so, they may be skewing the park acreage in a community.
- How large are the parks? Is there one large regional park? Are there many neighborhood parks?
- Where are the parks located? Are they located in areas where people can easily walk or bike to? Or are they more remote and require one to drive there?
- What are the amenities offered at the parks? Are they natural open space areas with few amenities? Do they have amenities that reflect the desires and preferences of the residents?
- What is the condition of those parks and the amenities they offer? Are they in poor condition and need to be refurbished or replaced?
It is nice to have a single figure like X acreage per 1,000 residents for the purpose of comparison, but it does not offer answers to the above questions. The median size of parks and park acreage as a percentage of a city’s land area are two additional measures that are related to the amount of parkland. Although helpful, they also do not address all of the above questions. While the amount of parkland is important, we should seriously consider the adequacy and validity of using just one indicator. Thus I recommend that we look at four additional metrics in order to more comprehensively understand and analyze the park needs of a community, as explained below.
Park Accessibility
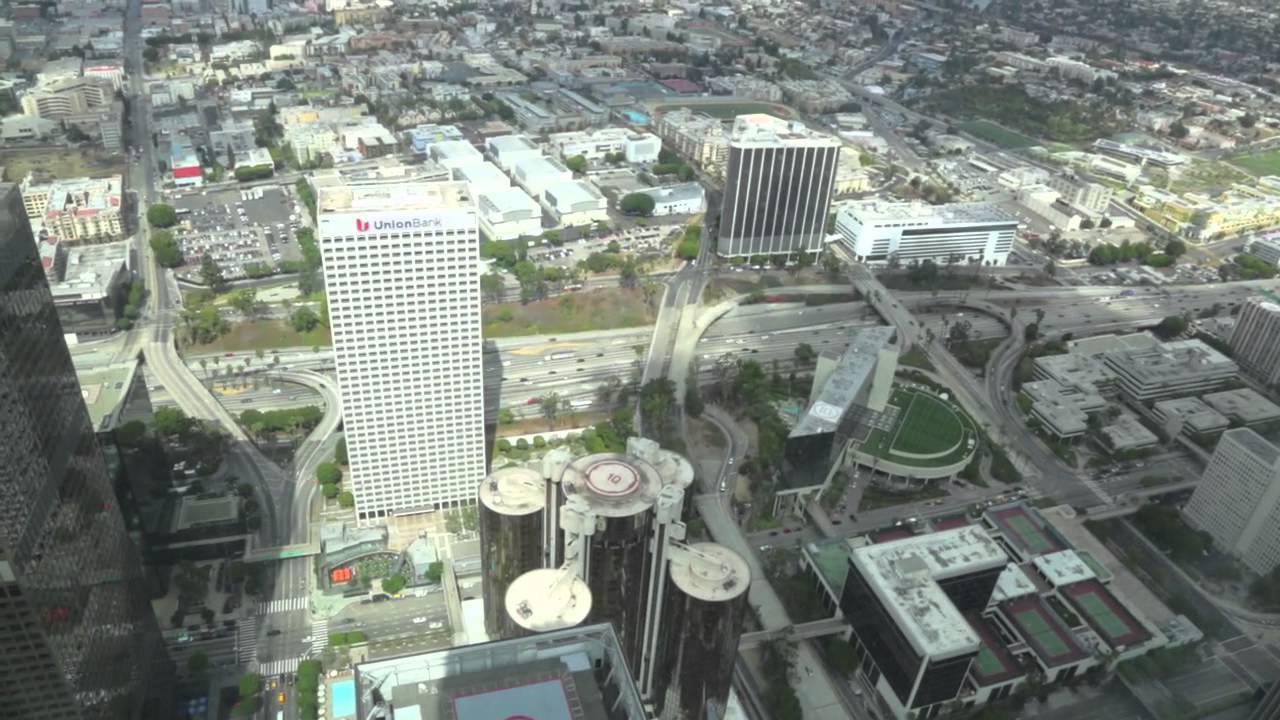
This metric is evaluated by using a Geographic Information System (GIS) and Census data to determine the percentage of households that are within walking distance from a park. Walking distance is most commonly defined as half a mile or a ten-minute walk. Of the 100 largest cities in the U.S. that have explicit park distance goals, over 60 percent use a half-mile. (For more information, please refer to this paper by Peter Harnik and Abby Martin.) You may have seen maps that show half-mile radii around parks to identify areas that are within or outside of the ten-minute walk threshold. While interesting, such maps do not reflect actual conditions unless the half-mile is defined as entirely within the public road network and uninterrupted by physical barriers such as freeways, train tracks, and rivers.
Park Pressure
Park pressure is a lesser known, but helpful metric that refers to the potential demand on a park, assuming that the residents in a “parkshed” use the park closest to them. Using GIS, the parkshed is defined by a polygon or a Park Service Area (PSA) containing all households having the given park as their closest park. The population within this PSA is then calculated, providing an estimate of the number of nearby potential park users. The acreage of the subject park is then used to calculate the number of park acres available per 1,000 people within the parkshed. Numerous studies have shown that people are more likely to visit the park closest to them and that people tend to visit their closest park more often than parks further away. Thus it is reasonable to assume that the population within the parkshed is the group most likely to use the park at the center of the parkshed. (For more information about this approach, please refer to this article by Chona Sister, Jennifer Wolch, and Holn Wilson.)
Quantity and Variety of Park Amenities
It should be obvious that not all parks are created equal and that the quantity and variety of amenities vary widely. Even though this is the case, we often compare the amount of parkland across cities as if it is a generic commodity that looks and functions the same way everywhere. I believe that we should be looking at the quantity and quality (to be discussed next) of the amenities available at a community’s parks and recreational facilities. Communities should take stock of what they have, especially the most common amenities like the following: playgrounds, swimming pools, tennis courts, basketball courts, baseball fields, soccer fields, multi-purpose fields, skate parks, fitness zones, picnic shelters, splash pads, gymnasiums, recreation centers, senior centers, restrooms etc. To get a sense of whether a community needs more of certain amenities, it can then compare to national, state, and/or city averages (e.g. X playgrounds per 100,000 population) based on data compiled by organizations like the Trust for Public Land.
Condition of Park Amenities
The condition or quality of park amenities is a key measure of park adequacy. Even if a community has many acres of parkland, its park needs may still be great because the amenities within those parks may be falling apart or the parks may lack the amenities that people desire. Thus, in addition to taking an inventory of park amenities, communities must also assess the condition of each park’s general infrastructure and amenities. General park infrastructure may include walkways, parking lots, park furniture, drainage and irrigation, lighting systems and vegetation. The condition of this infrastructure and park amenities may be rated as “Good,” “Fair,” or “Poor” or in any other way that allows a city to determine its deferred maintenance and park improvement needs in terms of costs.
In order to fully understand and analyze the park needs of communities, we must go beyond the traditional measure of parkland per 1,000 residents. As explained above, four additional metrics should be evaluated as well: park accessibility, park pressure, quantity and variety of park amenities, and condition of park amenities. If you are wondering whether it is realistic or feasible to carry out this comprehensive approach, I want to draw your attention to the Los Angeles Countywide Parks and Recreation Needs Assessment project which analyzes park needs for 189 study areas using all five metrics described above. This is a historic and exciting effort currently underway to document the park needs of all of the cities and unincorporated areas of Los Angeles County. I look forward to sharing more about the project in the coming months. Please stay tuned.
Note: Special thanks to the staff at PlaceWorks and the Los Angeles County Department of Parks and Recreation who are working passionately and diligently on the Countywide Parks and Recreation Needs Assessment.
Disclaimer: The opinions expressed in this article are those of the author alone, and do not reflect the official views or positions of the Los Angeles County Department of Parks and Recreation.
Source: UrbDeZine
November 12, 2015
By Clement Lau
http://losangeles.urbdezine.com/2015/11/12/park-needs-measured/